
The Secret Code Hidden in Nature: A Fibonacci Day Adventure


Every year on 11/23, we celebrate one of the most famous patterns in mathematics — the Fibonacci sequence.

What is the Fibonacci sequence?

It’s a list of numbers where each number is the sum of the two before it:

1, 1, 2, 3, 5, 8, 13, 21…

This simple rule creates a pattern that grows in a beautifully balanced way.
The Golden Rectangle & Golden Spiral

When squares with Fibonacci side lengths are arranged together, they form a golden rectangle — a shape whose proportions stay the same as it grows.

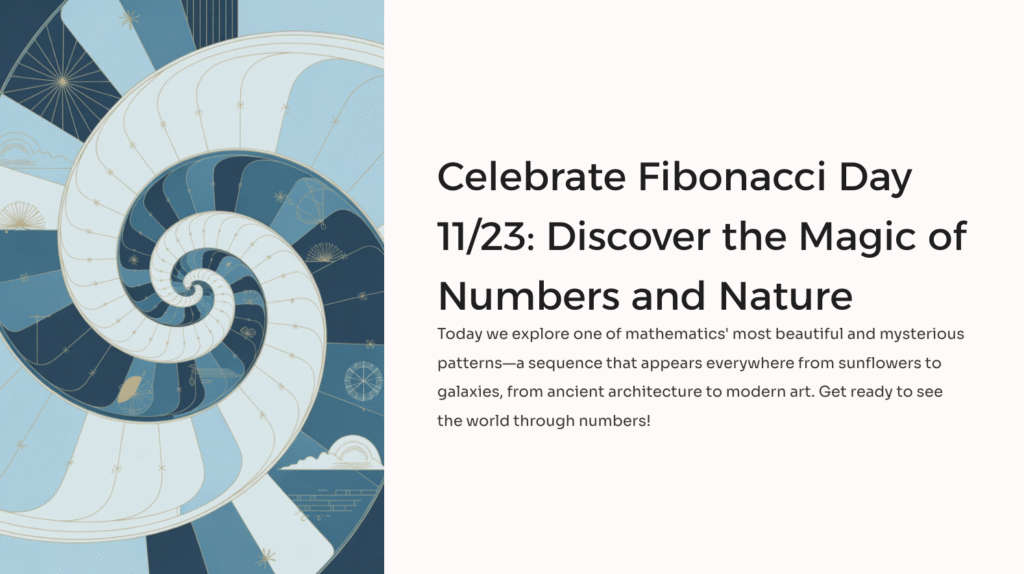
If you draw a smooth curve through the corners of these squares, you get the golden spiral, a shape that expands outward while keeping the same proportions. This spiral models growth found in many natural forms.
Where do we see it in nature?

The Fibonacci sequence is everywhere!

• Sunflower seeds grow in spirals that match Fibonacci numbers.

• Pinecones have spiral patterns that follow the sequence.

• Nautilus shells show growth close to the golden spiral.

• Hurricanes and galaxies swirl in spiral patterns with similar proportions.

• Even leaf arrangements follow Fibonacci spacing to help plants get more sunlight.


Fibonacci Day Resources
View activity in Google Slides.


Coming Soon: I will be using this Google Folder to share activities and lessons related to the Fibonacci Sequence. You can also access resources by selecting the “Resources” link and clicking on “Math”.Leonardo Pisano (Fibonacci) Biography
Fibonacci Sequence

Fibonacci Day reminds us that math is built into the fabric of the world around us. Look around today and see where you can spot these incredible patterns!

Comments

Popular posts from this blog

AI-Resistant Authentic Learning Experiences: Creating Meaningful Learning Experiences in the Age of AI

AI-Resistant Authentic Learning Experiences: Creating Meaningful Learning Experiences in the Age of AI What if the best way to make learning AI-resistant isn’t to ban AI—but to make learning worth doing? I’m excited to share an article I co-authored with my fellow AMLE Teacher Leader, Marri Bayor, AI-Resistant Authentic Learning Experiences: Creating Meaningful Learning in the Age of Artificial Intelligence. As educators, we’re navigating a new reality. Students have unprecedented access to artificial intelligence, and it’s easy to focus our energy on restrictions, detection, and preventing misuse.  But what if we asked a different question? How can we design learning experiences that AI can’t replace? In our article, Marri and I explore why we believe the answer starts with authentic learning. When students are solving meaningful problems, collaborating, defending their thinking, creating something that matters, and connecting learning to their own lives, AI becomes a tool—not a s...

Strategies for Building Culture Through Expectations in Middle School

As a member of the AMLE Teacher Leaders Committee, I recently had the opportunity to contribute to an article that became the foundation for a larger conversation about one of the most important parts of starting a new school year: building a strong middle school culture. Our Teacher Leaders group began by exploring the question: How do we establish expectations that build culture rather than simply manage student behavior? That conversation led to our AMLE article, Strategies for Building Culture through Expectations in Middle Schools. I was fortunate to contribute alongside fellow Teacher Leaders Megan Balduf, Marri Bayour, Corey Cohen, Ralph Covino, Beth Fabijanic, Laurie Rigg, Cheryl Robertson, and Kate Strein. But what I really appreciated about this process was the article was the beginning of the conversation and launched our first ever AMLE Teacher Talk round table focused on Setting Expectations and Norms in the New School Year. Expectations are more than just rules! Middle sc...

Beyond the Graph: Building Data Literacy Through Classroom Routines

  Beyond the Graph: Building Data Literacy Through Classroom Routines Every day, our students encounter data. They see statistics in social media posts, sports highlights, advertisements, news stories, weather forecasts, health claims, and infographics. They are constantly presented with graphs, percentages, averages, rankings, and claims about what the numbers supposedly tell us. But being surrounded by data does not automatically make someone data literate. As mathematics educators, we have an opportunity and a responsibility to help students think more critically about the data they encounter in their daily lives by asking deeper questions about the meaning behind it. Questions like: Where did these data come from and who is the source? How were they collected? What does this graph show—and what might it hide? Whose perspectives are represented? Whose are not represented? What patterns or variability do we notice? Is there potential bias? And perhaps most importantly: What concl...